
Sand Control Well Screen Selection research – Part 3
April 22, 2023
ENQUIRY Pipe Fittings : Elbow | flange | reducer from Singapore Cilent
April 27, 2023
Sand Control Screen Selection research – Part 4
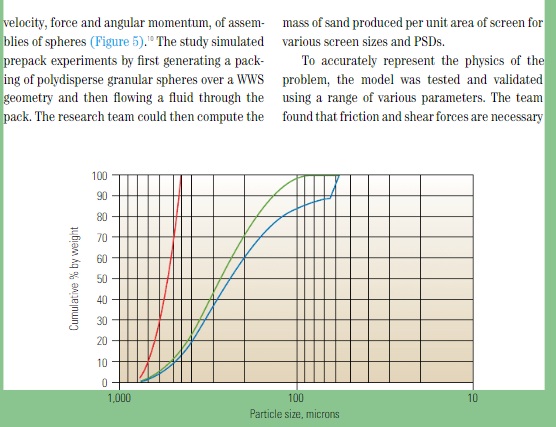
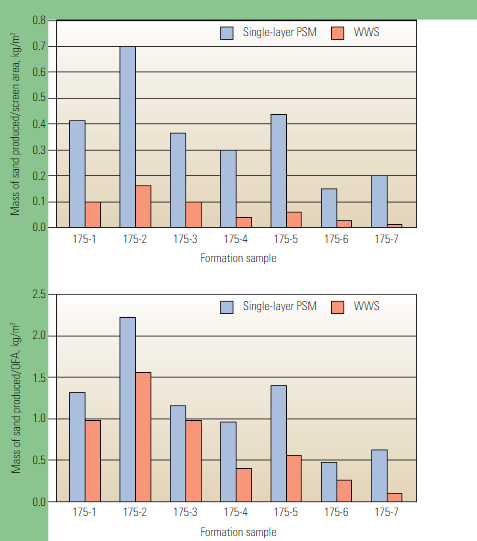
Figure 8. Comparison of sand production through plain square mesh (PSM) and wire wrap screens (WWSs). The mass of sand produced for seven PSD values through a 175-micron single-layer PSM is greater than that produced through a 175-micron WWS per unit screen area (top) and per unit open flow area (OFA) (bottom). (Adapted from Chanpura et al, reference 15.)
of the PSD of grains greater than the aperture-pore size. In addition, researchers found that sand production through the filter layer of a PSM screen of a given pore size is greater than that of a WWS of the same slot size (Figure 8).14The Mythology of Screen SelectionThe team’s work has cast doubt on, or added qualifications to, numerous widely held industry beliefs about WWSs and PSMs. These axioms, upon which many traditional screen selection methodologies for SASs have been based, include the contention that formation sand plugs screens.However, research has shown that following SRTs, when only trapped particles remained on the screens, final screen permeability was in the range of 5% to 100% of original screen permea-bility; the final value, then, of even the low-per-meability SAS screens, which have an original screen permeability of about 300 D, would be a minimum 15 D.
The screen permeability is thus significantly higher than most formations and thus too great to cause plugging; plugging is commonly quantified by a pressure differential created across the screen. Instead, plugging more likely occurs as the result of poorly condi-tioned mud or filtercake mixed with formation sand, mixed coarse and fine formation sands from a variety of zones or clay and shale mixed with formation sand.15PSD and PoSD When SRTs are performed in the laboratory using formation sand, the sand PSD is often not needed. However, PSD is required if there is a large spread in formation PSD along the well, or if the SRT is performed using a sample that was gener-ated based on specified PSD or if a model is used to estimate sand production for a given sand PSD–screen combination. Particle size distribu-tion of formation sand is typically determined through dry sieve analysis or laser particle size analysis (LPSA).16
Dry sieve analyses determine PSD through a mechanical separation of particles by filtering them from top to bottom through a series of pro-gressively finer sieves. The measured weight of the sand captured in each sieve is used to calcu-late cumulative percentage mass of each, which is then plotted against sieve size on a semiloga-rithmic scale. Laser particle size analyses determine PSD by measuring how light is scattered as a laser beam is passed through a sand sample. The angle of scatter is inversely proportional to the particle size.
17 To ensure that the sand samples are deliv-ered to the measurement device in the correct concentration and in a stable state, LPSA is per-formed on samples whose dispersion is controlled by dry or, when necessary, fluid dispersants. Sand control experts have long used dry sieve and LPSA nearly indiscriminately, and persistent differences in the results obtained from the two methods have been well docu-mented. Recent research indicates these incon-sistencies may be caused by the aspherical shape of the particles, sampling practices for LPSA, fluids used and various light blocking lev-els used in the LPSA. Based on these observa-tions, PSD determined by dry sieve analysis is recommended for both slurry-type SRT testing and sand production prediction using the above models.
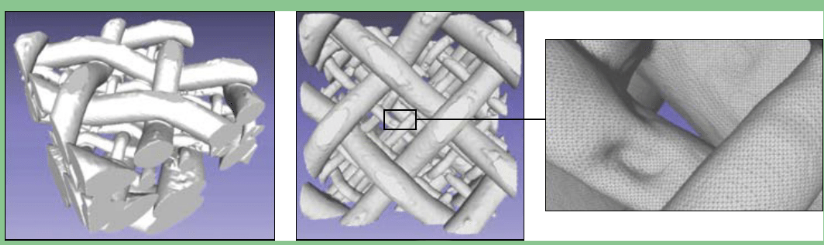
Figure 9. High-resolution microCT scans of PSM. A 3D PSM screen image (left) can be reconstructed from a microCT scan using a commercially available computer-aided design format that is able to preserve and reproduce minute detail (center and right ). (Adapted from Mondal et al, reference 19.)
However, errors or differences attrib-uted to particle shape differences may still occur.18 These differences may be minimized by characterizing the particle shape and aspect.Recent investigations of mesh screens have highlighted the need to account for screen com-plexity from layered design when modeling sand production. Using microcomputed tomography (microCT) images, researchers constructed 3D images of two metal mesh screen types: PSM and plain Dutch weave (PDW) (Figure 9).
These 3D images of virtual screens were validated by com-parison with the microCT images. The team then conducted DEM simulations that were validated by experiments of prepack SRTs through multilayer PSMs and PDWs. Analyses of microCT scan meshes indicated that mesh screen layers overlap significantly and thus impact retention efficiency. The group developed a method to calculate the retention pore size dis-tribution (PoSD) and effective pore size for a given overlap of PSM samples. The calculated PoSD can be used in the analytical model to improve sand production prediction in a slurry-type SRT.As a consequence of this work, the perfor-mance of nominal size MMSs can be simulated using any reservoir sand size distribution. To date, because the team has been able to charac-terize PSMs, operators are able to evaluate a large number of PSMs in a short time and thus reduce the number of SRTs that must be run to choose the optimal screen size for a given reser-voir.19 In time, this work will be expanded to include additional screen types.
By the Numbers Engineers use SRTs to choose the optimal screen from a range of screens selected based on a rela-tionship between screen openings and grain sizes. Although SRT results can be impacted sig-nificantly by relatively small changes to test con-ditions, when performed properly, the SRT is widely considered a reliable method for finalizing screen choice. The drawback to this process, however, lies in the dubious traditional practices used to narrow the range of screen choices and in misinterpretation of pressure developments in standard SRT experiments. This process often forces operators to choose to perform many time-consuming SRTs before qualifying a screen as optimal for long horizontal sections that have varying sand PSD.By replacing traditional methods with numer-ical and analytical models, operators may reduce and eventually eliminate the dependence on SRTs. In addition, because traditional screen selection methodology tends to be conservative, a software-based approach may allow operators to opt for SASs over gravel packs, which are typi-cally more expensive.
When working offshore West Africa required sand control for a nonuniform unconsolidated formation, a major operator based its screen selection process on traditional d10 preselection criteria and on SRTs for finalizing its selection. The completions team also compared the results of the laboratory tests to numerical models. The targeted reservoir is the second sand in the offshore field; wells in the first sand of the field were completed using sand control devices selected based solely on traditional methods
However, the first formation produced is made up of highly uniform, well-sorted reservoir sands that have very low levels of fines content. By con-trast, the targeted sand in the second reservoir is much less uniform, poorly sorted and has higher fines content. In the face of these adverse sand control indicators, the operator opted to perform as rigorous a selection process as possible and to check selections based on traditional and SRT methods against those using simulations and mathematical models.In comparing results, the operator concluded that selections based on the results of SRTs and those based on the mathematical models matched closely. The operator added that although models require laboratory data for proper calibration, they held significant potential for aiding screen size selection without the need for continued laboratory testing when applied in regions for which extensive SRT data existed.20The quantity of and interaction between the variables that engineers must consider in choos-ing a sand control strategy can be daunting.
For decades, engineers have relied on the experience of their predecessors to help them sort the data and arrive at decisions. Today, however, because of the growth of computing power and capacity, operators may avail themselves of more accurate and less compromising methods for sand control selection. Based on physics and mathematics, these new methods promise not only a quicker, less costly path through the selection process, but one that provides engineers with the cer-tainty that they have chosen an optimal sand con-trol strategy for any given formation.


