Sand Control Well Screen Selection research – Part 2
April 22, 2023
Sand Control Well Screen Selection research – Part 4
April 22, 2023Sand Control Screen Selection research – Part 3
Model AlternativeA team from academia and industry reviewed recent screen testing advancements, interpreta-tion and modeling for SAS applications. Based on its findings, the team has proposed a screen selection method based on laboratory test–veri-fied numerical and analytical models.The primary purpose of this method is to elim-inate or reduce the number of physical SRTs that must be performed when selecting a screen size and type for a given application and to better understand the science of sand retention.
The study used numerical SRT simulations that matched experimental data in an effort to aid the team in understanding and relating PSD-screen combinations and to correlating sand production with formation sand PSD until sand production stops or is limited to fines.9The team first studied WWSs, which have a simpler geometry than that of other screen types, and performed simulations using the discrete element method (DEM). This numerical model describes mechanical behaviors, such as mass,

Figure 5. Simulations of sand retention tests using the discrete element method (DEM). Using the DEM, scientists track information such as mass, velocity, force and momentum about each particle within the computational domain, or simulation box (left). Researchers used the DEM and a molecular dynamics simulator to model performance in a prepack experiment by generating a packing of polydisperse granular spheres (multicolored balls) over a wire wrap screen geometry (blue layer) and then flowing liquid through the pack. The individual size and number of particles per size were obtained from the measured particle size distribution of the formation sand sample used for the corresponding experiment. Discrete element method simulations were then used to calculate the mass of sand produced per unit area of screen for various screen sizes and particle size distributions. Near the end of the polydisperse simulation, which required 24 hours on a 48-processor network cluster, sand particles (right, green, purple, brown, blue and white) bridge across the screen openings (pink)
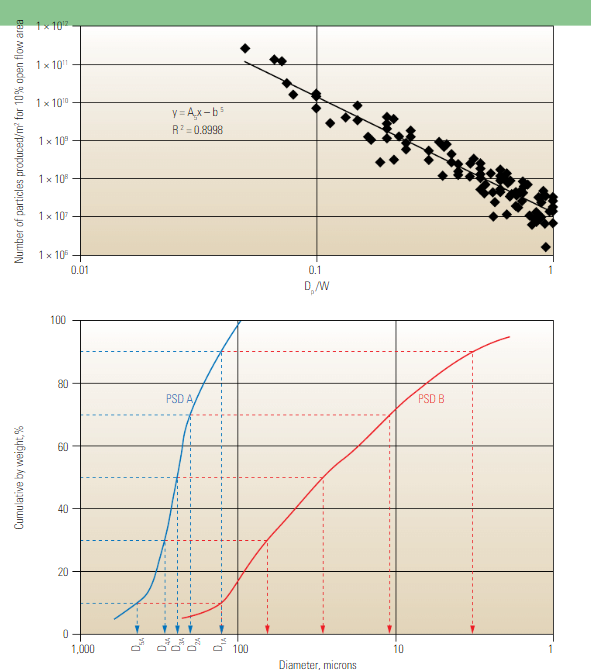
Figure 6. Determining mass of sand produced and entire formation particle size distribution. The Mondal-Sharma (M-S) method uses a correlation between the number of particles of diameter Dp produced through a screen slot opening of width, W. The number of particles of each diameter produced through the screen are counted and plotted against Dp/W from every simulation (top). In this case, formation PSDs A and B were distributed into five bin sizes each (bottom, dashed lines) to generate the number-based size distributions (D1A to D5A and D1B to D5B) used to populate the simulation box (bottom). (Adapted from Mondal et al, reference 9.)
Figure 7. Particle size distribution (PSD) of retained and produced formation sand. The PSD of the first layer of sand retained on the screen (red) has the expected distribution of the sand particles of widths greater than the slot size. The PSD of the second layer (green) is approaching that of the formation sand (blue). Because the sizes of the particles retained on the second layer are dictated by the pore sizes of the first layer, the retained particles will eventually be of the same PSD and permeability as the formation sand. (Adapted from Chanpura et al, reference 13.)
to form stable particle bridges, whereas the most critical parameter affecting the number of sand particles produced is the ratio of the slot width to particle diameter. Similarly, high fluid viscosities and low pressure gradients facilitate particle bridging; increased fluid pressure increases par-ticle production when pressure gradients are up to about 2.3 MPa/m [100 psi/ft]. At higher gradi-ents, however, there is no such dependence.When the results from the DEM model were plotted, the team observed a power-law relation. This relationship was confirmed by plotting the experimental data, which revealed excellent agreement and consistent trends between model and experimental results.
Based on this newly established relation, the team developed the Mondal-Sharma (M-S) method, which uses the number and size of the produced solids to esti-mate the mass of sand produced (Figure 6).
When comparing the estimated mass of sand pro-duced using the M-S method with the mass of sand produced in experiments, a good match was found. The M-S method, which uses DEM simula-tion results to develop a simple correlation, can be used to estimate the mass of sand produced without performing DEM simulations for every possible sand and screen combination.11The research team next extended the applica-tion of the M-S method to include plain square mesh (PSM) screens, achieving much the same outcomes. Some conclusions from WWS and PSM simulations included the following:• Simulations are able to estimate the mass of sand produced for a given PSD and screen size.• Simulations results strongly agree with those from carefully controlled prepack experiments.• Simulations show that the mass of sand pro-duced per unit screen area and for unit open flow area is larger for single layer PSMs than for slot geometry of the same rating and corre-sponding standard open flow area.• Simulations show that the ratio of wire thick-ness to opening size seems to be a key factor contributing to the increased mass of sand pro-duction from single layer PSMs.
12Researchers then turned their attention to analytical solutions and Monte Carlo simulations to predict sand production through WWSs and PSM screens under slurry test conditions. Their results showed that the analytical solution and the numerical simulation were in excellent agreement. The team showed that its proposed methods were able to estimate both mass and size distribution of the produced solid in a slurry-type SRT, taking into account the full PSD of for-mation sand. Simulations also showed that, with the exception of a mobile fines problem, sand production becomes negligible once the slot opening has been covered by particles larger than the opening (Figure 7).
As in the case of modeling prepack-type SRTs, the proposed methods can be used to estimate sand production in slurry-type SRTs for various screen sizes, thereby enabling screen size selec-tion based on an acceptable level of sand produc-tion. Final screen selection may then be confirmed through a slurry-type SRT.13 Results showed that more than 90% of the total sand pro-duction by mass occurs during the formation of the first layer of particles on the screen and that the PSD of the retained sand approaches that of the formation sand after a few layers of sand accumulate on the screen. Results also revealed that the mass of sand produced during the formation of the first layer of particles on the screen is independent of the shape of the PSD for grains smaller than the aperture-pore size and is governed by the shape

