
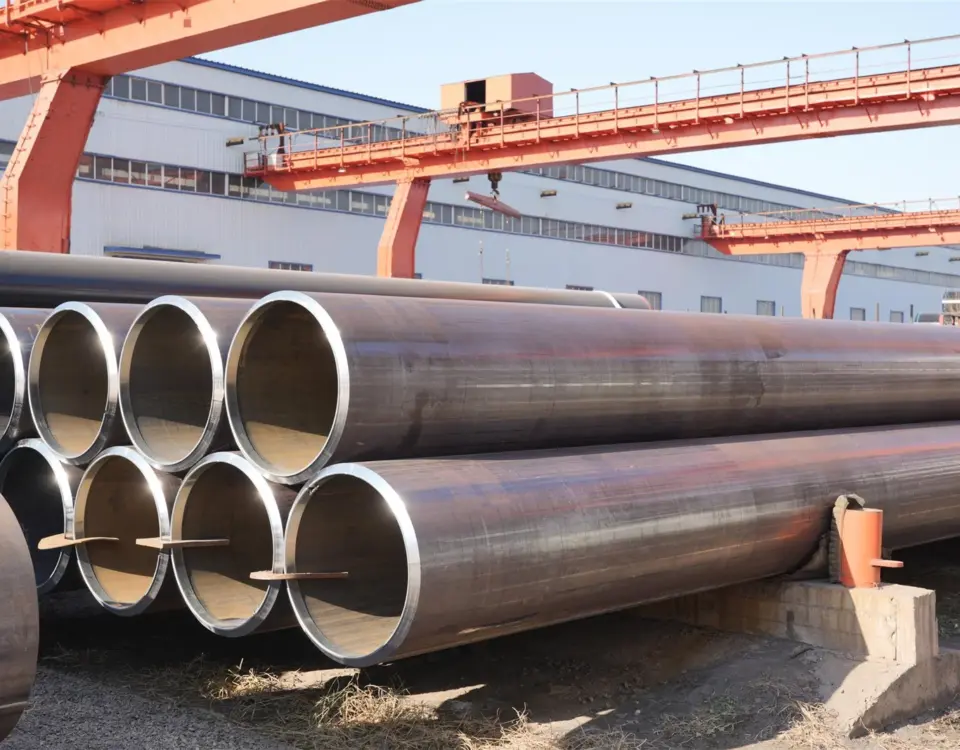
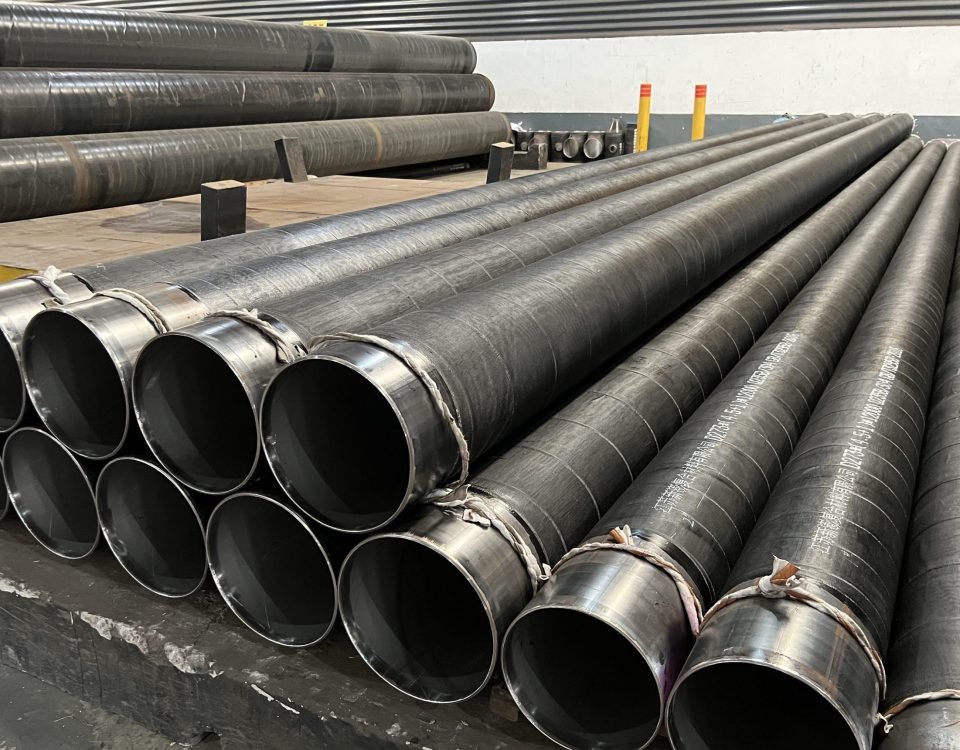
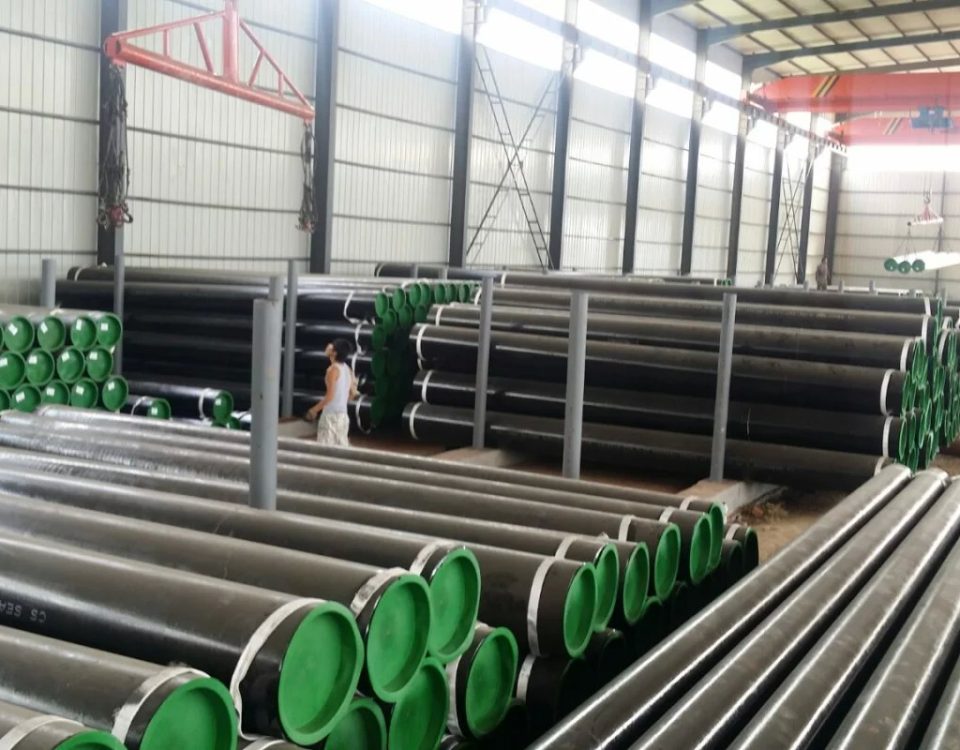
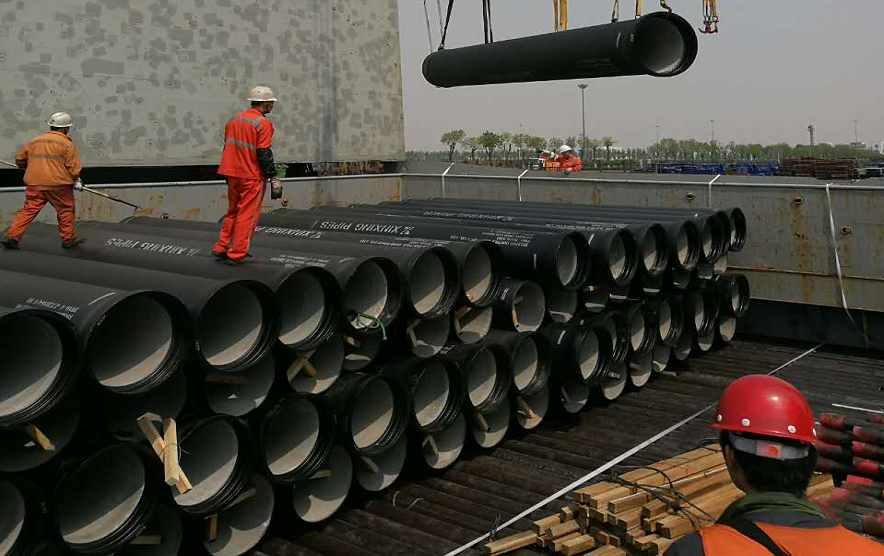
Kazakhstan Client need flange , API5L LSAW steel pipe
April 10, 2023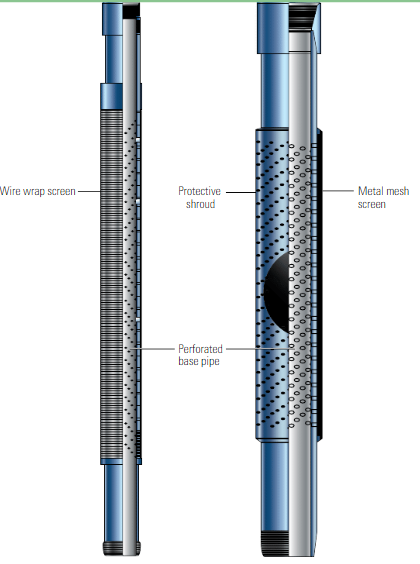
Sand Control Well Screen Selection research – Part 2
April 22, 2023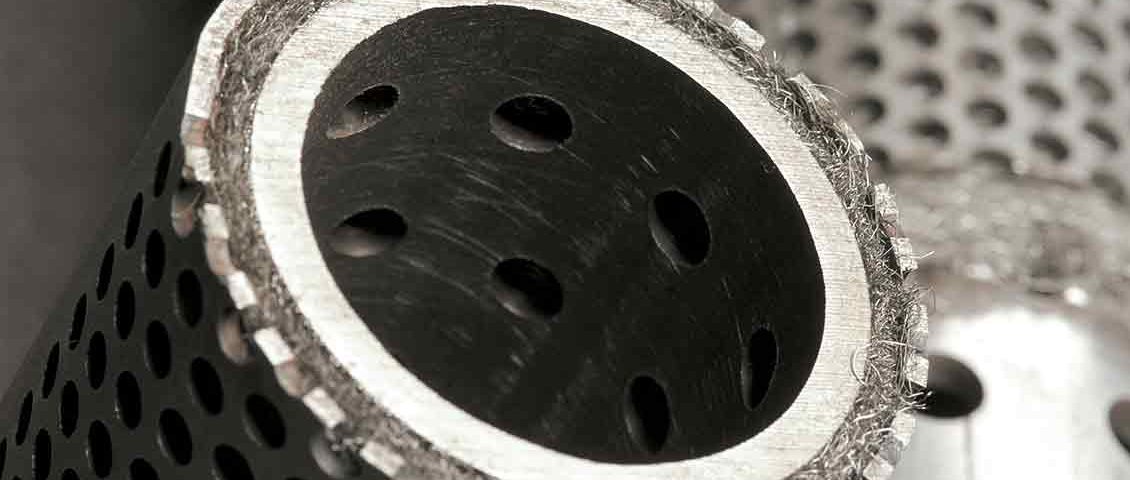
Sand Control Screen Selection research – Part 1
22 Oilfield ReviewSand Screen SelectionMany formations produce sand that may hinder production or damage completion and surface equipment. For decades, the industry has chosen sand control screens to address this threat based on traditional practices. Research suggests a new methodology that uses numerical simulation for selecting screen size and type may improve outcomes
Adopting methods first used in water wells, early 20th century oil and gas operators concerned with potential sand production from unconsoli-dated formations completed wells using pipe that had slotted or round openings. The openings, placed across the production interval, were sized to prevent sand from entering the wellbore while minimally constricting fluid flow
In time, the oil and gas industry developed sand retention methods that incorporated screens, resin- or plastic-coated particles and gravel packs. Some companies have, in recent years, sought to distinguish between sand man-agement and sand retention, in which the former uses techniques such as orientation of the well-bore and perforations, monitoring and control o
well pressures, fluid rates and sand influx to limit sand production.1 Sand retention, or sand con-trol, refers to the use of screens and other tools to reduce the risks of sand production without restricting oil and gas productivity. Early sand control efforts centered on the assumption that choosing the optimal sand screen was based on a relationship between screen opening and a single point in grain size distributions. Experiments performed under ideal prepack test conditions using spheres of a single diameter led early researcher C.J. Coberly to conclude that negligible particle production occurs through rectangular slots of widths that are twice the particle diameter or through circu-lar openings that have diameters three times that particle diameter (Figure 1).2In formation sand samples, particles have a size distribution, which forced Coberly to pick a characteristic diameter, d, within that size distri-bution based on physical experiments using for-mation sand samples.
Sizing the slot width to twice d10 (2d10) to allow negligible transient sand production is known as the Coberly rule. In response to Coberly’s work, H.D. Wilson wrote that for sand samples from the US Gulf Coast, for example, proper retention of sand required sizing the slots to no larger than d10.3 Industry experts have concluded that the differences in those con-clusions are related to what constitutes a negli-gible amount of produced sand and to the attempt to characterize the entire particle size distribu-tion using a single parameter. Other aspects of selecting a slot or screen size based on traditional practices involve taking rep-resentative sand samples and characterizing those samples. Most representative samples are obtained through conventional cores retrieved from known depths. To characterize formations, laboratory tech-nicians determine the particle size distributions (PSDs), typically by sieve or laser analysis or both. In recent years, the use of laser particle size analysis (LPSA) has become common in some companies because such analysis can bet-ter provide the details of the finer portion of the particle size distribution than can sieve analysis. In addition, laser analysis is less labor intensive than sieve analysis and thus typically lower in cost, which allows operators to economically ana-lyze many samples.Using the most representative sample avail-able, engineers typically determine proper screen openings based on the coarsest 10% of a particle size distribution, or d10. Screens that have slot widths determined by this process are designed to allow some amount of sand to pass
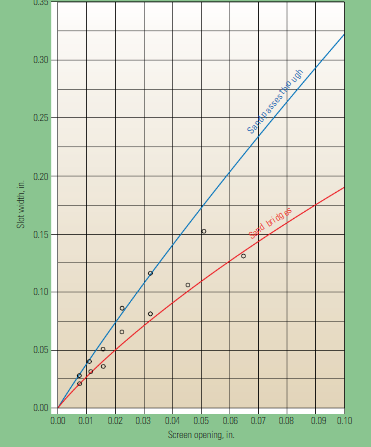
Figure 1. Traditional method for sizing screens. Tests performed in the 1930s, using sands of a single grain size on screens that had rectangular slots, resulted in curves that are nearly linear functions. A stable particle bridge formed across slots whose width was about twice that of the grain diameter (red), and all sand passed through the screen that had a slot size about three times the grain diameter (blue). (Adapted from Coberly, reference 2).
while the coarsest particles are retained by size exclusion or bridging. In the process of reten-tion, fine particles are retained by the pore space of the coarse grains and even finer parti-cles retained between the pore space of the fine particles; this process repeats until sand pro-duction ceases. This article describes the process by which engineers match optimal wire wrap and metal mesh stand-alone screen (SAS) size and type to target formations in openhole completions. In addition, this article discusses a technique that allows engineers to use the entire sand size dis-tribution when selecting a screen and to quickly narrow the range of screen sizes and types to optimize sand control.
This process often results in sand control decisions more suited to the well at hand than is possible using past practices that use only one design parameter, such as d10, and reduces the number of laboratory tests that must be performed to determine the optimal choice for the target formation. A case history from offshore West Africa demonstrates the potential for the methods discussed.How Choices Are MadeBefore the drill bit breaks ground, operators must make various decisions that will impact how the completion is finally configured. Engineers must then decide whether to case, cement and perforate the production interval or to use an openhole completion. Openhole completions, typically less costly than cased hole completions, may be completed using gravel packs or stand-alone screens if the formation is expected to produce sand. Stand-alone screen types include wire wrap screens (WWSs) and metal mesh screens (MMSs). To cre-ate a WWS, manufacturers wrap wire around a perforated base pipe. The wire is either placed

